
How Can You Determine Your Exact US Federal Income Tax Liability in 2026?
To calculate your US federal income tax in 2026, you must first calculate your Gross Income, subtract the IRS standard deduction (or itemized deductions) to determine your Taxable Income, and then apply the progressive marginal tax brackets. Your income is not taxed at a single flat rate; instead, different portions of your income are taxed at progressively higher rates as you move up through the brackets. For tax year 2026, the standard deduction is $16,100 for single filers and $32,200 for married couples filing jointly.
Quick Answer Summary
To find your tax bill:
- Gross Income (W-2, 1099, dividends) minus Standard Deduction ($16,100 Single / $32,200 Married) = Taxable Income.
- Apply the 2026 marginal tax brackets (10%, 12%, 22%, 24%, 32%, 35%, 37%) to separate chunks of your taxable income.
- Sum the tax owed from each bracket to get your total federal tax liability.
What Are the Confirmed Standard Deductions for the 2026 Tax Year?
Before you apply the tax brackets, you must calculate your Taxable Income. You do this by subtracting deductions from your gross income. The standard deduction is a fixed amount that the IRS allows you to deduct from your income tax-free, without needing to track individual receipts.
According to IRS Revenue Procedure 2025-32, the standard deduction amounts for the 2026 tax year have been adjusted upward for inflation to the following levels:
| Filing Status | Standard Deduction (2026) | Standard Deduction (2025 Comparison) |
|---|---|---|
| Single | $16,100 | $15,000 |
| Married Filing Jointly | $32,200 | $30,000 |
| Head of Household | $24,150 | $22,500 |
2026 standard deduction vs 2025
If your itemized deductions (such as mortgage interest, state and local taxes, and charitable contributions) exceed these standard amounts, you should itemize. Otherwise, taking the standard deduction is the tax-optimal choice.
How Do US Progressive Tax Brackets Work?
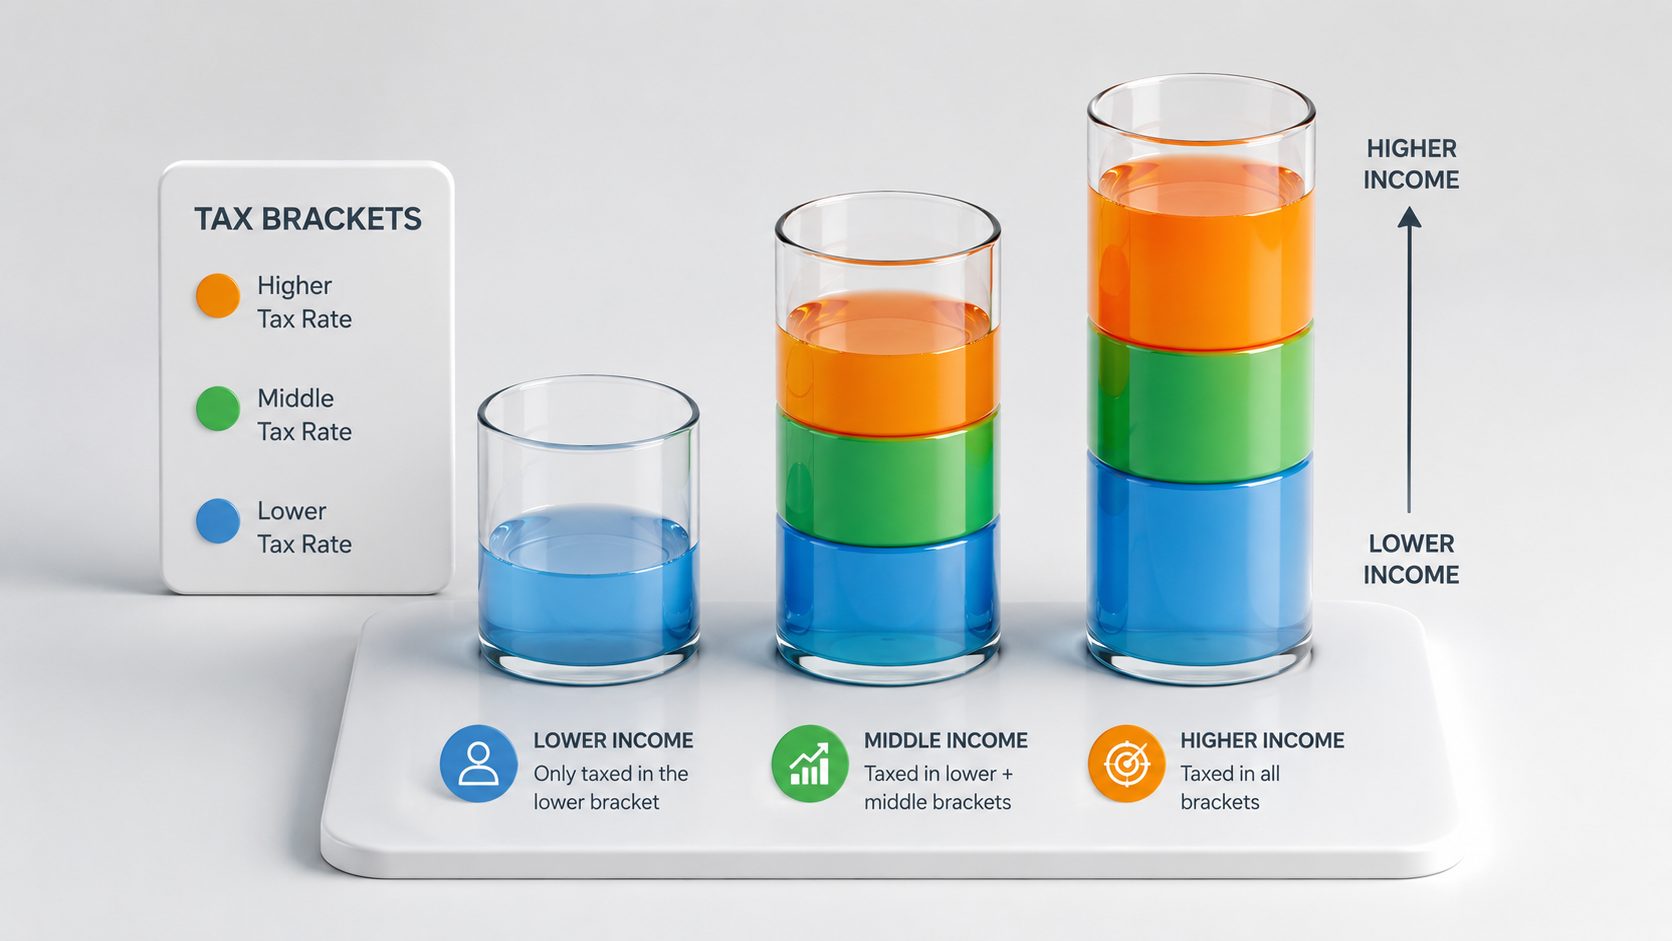
One of the most pervasive myths in personal finance is that moving into a higher tax bracket means your entire income is now taxed at that higher rate. This is entirely false. The US federal income tax system is progressive, meaning it is structured in layers or "brackets."
Think of the tax brackets as a series of buckets. As you earn money, you fill the first bucket. Once that bucket is full, any additional money you earn spills over into the next bucket, which is taxed at a higher rate. Your first dollar of taxable income is taxed at the lowest rate (10%), regardless of whether you earn $20,000 or $2,000,000 a year.
For example, if you are a single filer with a taxable income of $50,000 in 2026, you do not pay 22% on all $50,000. You pay 10% on the first segment, 12% on the second segment, and 22% only on the small portion that exceeds the 12% bracket threshold.
Official 2026 Federal Income Tax Brackets and Rates
Once you have subtracted your standard deduction, you apply the marginal brackets to your remaining taxable income. Below are the official tax brackets for individual filers, married couples filing jointly, and heads of household for tax year 2026 (filed in early 2027):
Single Filers (Tax Year 2026)
| Tax Rate | Taxable Income Band | Tax Owed Calculation |
|---|---|---|
| 10% | $0 to $12,400 | 10% of taxable income |
| 12% | $12,400 to $50,400 | $1,240 + 12% of amount over $12,400 |
| 22% | $50,400 to $105,700 | $5,800 + 22% of amount over $50,400 |
| 24% | $105,700 to $201,775 | $17,966 + 24% of amount over $105,700 |
| 32% | $201,775 to $256,225 | $41,024 + 32% of amount over $201,775 |
| 35% | $256,225 to $640,600 | $58,448 + 35% of amount over $256,225 |
| 37% | Above $640,600 | $192,979.25 + 37% of amount over $640,600 |
Married Filing Jointly (Tax Year 2026)
| Tax Rate | Taxable Income Band | Tax Owed Calculation |
|---|---|---|
| 10% | $0 to $24,800 | 10% of taxable income |
| 12% | $24,800 to $100,800 | $2,480 + 12% of amount over $24,800 |
| 22% | $100,800 to $211,400 | $11,600 + 22% of amount over $100,800 |
| 24% | $211,400 to $403,550 | $35,932 + 24% of amount over $211,400 |
| 32% | $403,550 to $512,450 | $82,048 + 32% of amount over $403,550 |
| 35% | $512,450 to $768,700 | $116,896 + 35% of amount over $512,450 |
| 37% | Above $768,700 | $206,583.50 + 37% of amount over $768,700 |
Head of Household (Tax Year 2026)
| Tax Rate | Taxable Income Band | Tax Owed Calculation |
|---|---|---|
| 10% | $0 to $17,700 | 10% of taxable income |
| 12% | $17,700 to $67,450 | $1,770 + 12% of amount over $17,700 |
| 22% | $67,450 to $105,700 | $7,740 + 22% of amount over $67,450 |
| 24% | $105,700 to $201,775 | $16,155 + 24% of amount over $105,700 |
| 32% | $201,775 to $256,225 | $39,213 + 32% of amount over $201,775 |
| 35% | $256,225 to $640,600 | $56,637 + 35% of amount over $256,225 |
| 37% | Above $640,600 | $191,168.25 + 37% of amount over $640,600 |
Step-by-Step Walkthrough: A Real Persona-Based Tax Calculation
To make this math real, let's look at Sarah, a 32-year-old software engineer living in Austin, Texas. Sarah is filing as Single, and her total gross earnings for 2026 are $95,000 (from her salary and some interest on savings). She does not have complex deductions, so she will claim the standard deduction.
Here is how we calculate Sarah's tax bill step-by-step:
Step 1: Calculate Taxable Income
- Gross Income: $95,000
- Subtract Standard Deduction: -$16,100
- Taxable Income: $95,000 - $16,100 = $78,900
Step 2: Apply the Brackets
Sarah's taxable income of $78,900 spans three tax brackets: 10%, 12%, and 22%.
- 10% Bracket: The first $12,400 of her taxable income is taxed at 10%:
Tax 1 = $12,400 × 10% = $1,240
- 12% Bracket: The income between $12,400 and $50,400 is taxed at 12%:
Taxable in this band = $50,400 - $12,400 = $38,000
Tax 2 = $38,000 × 12% = $4,560
- 22% Bracket: The remaining taxable income above $50,400 is taxed at 22%:
Taxable in this band = $78,900 - $50,400 = $28,500
Tax 3 = $28,500 × 22% = $6,270
Step 3: Sum the Tax Bill
- Total Federal Income Tax: $1,240 + $4,560 + $6,270 = $12,070
Sarah's total federal income tax for 2026 is $12,070.
Sarah's $12,070 bill, bracket by bracket
Marginal vs. Effective Tax Rates: What's the Real Difference?
Using Sarah's profile, we can clarify the vital difference between her marginal tax rate and her effective tax rate.
- Marginal Tax Rate: This is the tax rate applied to the next dollar of income she earns. For Sarah, her last dollar of income sits in the 22% tax bracket. If she gets a $1,000 bonus, that bonus will be taxed at 22% ($220). Thus, her marginal tax rate is 22%.
- Effective Tax Rate: This is the actual percentage of her income that she pays in taxes. It is calculated by dividing her total tax bill by her gross income:
Effective Tax Rate = Total Tax Owed ÷ Gross Income = $12,070 ÷ $95,000 = 12.70%
Even though Sarah is in the 22% tax bracket, she only pays 12.70% of her total income to the federal government. This is why you should never turn down a raise or promotion out of fear that a higher tax bracket will decrease your take-home pay. Only the money above the bracket line is taxed at the higher rate.
What Are the Most Effective Strategies to Lower Your 2026 Taxable Income?
If you want to keep more of your hard-earned money, you must act before December 31st to lower your taxable income. Here are the most effective ways to lower your tax bill:
1. Maximize Workplace Retirement Plans
Contributing to a traditional 401(k) or 403(b) reduces your taxable income. For 2026, the employee contribution limit is $24,500. If Sarah contributes $10,000 to her 401(k), her taxable income drops to $68,900, saving her $2,200 in federal income taxes (since she is in the 22% marginal bracket).
2. Fund a Traditional IRA
Individual Retirement Accounts offer tax-deductible contributions. For 2026, you can contribute up to $7,500 (plus an extra $1,100 catch-up if you are age 50 or older), subject to income limits if you also have a workplace retirement plan.
3. Use a Health Savings Account (HSA)
Known as the "triple tax advantage" account, HSA contributions are pre-tax, grow tax-free, and can be withdrawn tax-free for qualifying medical expenses. For 2026, you can contribute up to $4,400 for self-only or $8,750 for family coverage.
Common Tax Deductions and Credits You Should Check in 2026
When filing your taxes, several common mistakes can cost you money or trigger an audit:
- Confusing standard vs. itemized deductions: Many taxpayers spend hours itemizing receipts only to find their total deductions are less than the standard deduction. Take the higher of the two.
- Missing state tax deductions: Some states have state income tax (like California, New York), while others do not (like Texas, Florida). If you live in a state with high income or property taxes, you can deduct up to $10,000 of state and local taxes (SALT) if you itemize.
- Forgetting about Saver's Credit: Low-to-moderate-income taxpayers who contribute to retirement plans may qualify for a tax credit of up to $1,000 ($2,000 for married couples) on top of the standard deduction.
High Earners: Capital Gains, AMT, and NIIT
For high-income earners, federal income tax calculations become more complex due to additional taxes:
- Net Investment Income Tax (NIIT): A 3.8% tax applied to investment income (like capital gains and dividends) for single filers with modified adjusted gross income (MAGI) above $200,000 (or $250,000 for married couples filing jointly).
- Alternative Minimum Tax (AMT): A separate tax system designed to ensure high earners who claim many tax deductions still pay a minimum amount of tax. The AMT exemption amount for 2026 is indexed to inflation to prevent taxpayers from being hit unintentionally.
- Capital Gains Taxes: If you sell investments held for more than one year, you are taxed at long-term capital gains rates (0%, 15%, or 20%), which are significantly lower than ordinary income tax rates. This encourages long-term investing.
Related tools can help you model these taxes dynamically. Use the US Income Tax Calculator to compute your exact state and federal liability based on your local brackets.
Advanced Strategic Implementation & Optimization for US Taxpayers
Navigating the US tax system requires a proactive approach to managing your tax brackets and deductions throughout the year. Below is a full guide to optimizing your federal tax liability.
Year-Round Tax Planning Checklist
- Track Deductions Continually: Keep records of mortgage interest statements (Form 1098), charitable donations, and state/local tax receipts.
- Use Tax-Loss Harvesting: Sell underperforming investments in taxable accounts to offset capital gains and up to $3,000 of ordinary income.
- Coordinate with Fiscal Calendars: Make final HSA and IRA contributions before the April filing deadline to apply deductions to the prior tax year.
Step-by-Step Optimization Strategy
- Analyze Your Adjusted Gross Income (AGI): Determine your starting point by summing all wages, interest, and dividends.
- Maximize Above-the-Line Deductions: Prioritize contributing to your traditional 401(k) and HSA, which directly reduce your AGI.
- Compare Deduction Options: Run calculations comparing the standard deduction ($16,100 for Single filers) against itemized deductions.
- Use the Backdoor Roth IRA: If your MAGI exceeds the direct contribution limits, use a non-deductible Traditional IRA contribution followed by a Roth conversion.
Common Pitfalls & Audit Warnings
- Mixing Up Deduction Types: Claiming both standard and itemized deductions on the same return is invalid.
- Ignoring Net Investment Income Tax (NIIT): High earners must prepare for the additional 3.8% tax on investment earnings when MAGI exceeds $200,000.
- Incorrect Filing Status: Filing as Single when you qualify as Head of Household (or vice versa) can lead to penalties and missed deductions.
Advanced Tax Liability Scenario Modeling & Worksheets
To help you project your federal income tax, we have modeled three common taxpayer profiles for the 2026 tax year. These scenarios demonstrate how standard deductions and progressive brackets interact under different income levels.
Scenario Comparison Table
| Metric | Profile A: Entry-Level | Profile B: Mid-Career | Profile C: High-Earner |
|---|---|---|---|
| Gross Income | $45,000 | $115,000 | $280,000 |
| Filing Status | Single | Single | Married Filing Jointly |
| Standard Deduction | $16,100 | $16,100 | $32,200 |
| Taxable Income | $28,900 | $98,900 | $247,800 |
| Top Marginal Bracket | 12% | 22% | 24% |
| Total Federal Tax | $3,220 | $16,466 | $44,648 |
| Effective Tax Rate | 7.16% | 14.32% | 15.95% |
Effective tax rate across three profiles
Step-by-Step Calculation Walkthroughs
Profile A: Entry-Level ($45,000 Gross, Single)
- Taxable Income: Gross Income ($45,000) minus Standard Deduction ($16,100) = $28,900.
- First Bracket (10%): The first $12,400 is taxed at 10% = $1,240.
- Second Bracket (12%): The remaining taxable income ($28,900 - $12,400 = $16,500) is taxed at 12% = $1,980.
- Total Liability: $1,240 + $1,980 = $3,220.
Profile B: Mid-Career ($115,000 Gross, Single)
- Taxable Income: Gross Income ($115,000) minus Standard Deduction ($16,100) = $98,900.
- First Bracket (10%): The first $12,400 is taxed at 10% = $1,240.
- Second Bracket (12%): The income segment between $12,400 and $50,400 ($38,000) is taxed at 12% = $4,560.
- Third Bracket (22%): The remaining segment ($98,900 - $50,400 = $48,500) is taxed at 22% = $10,670.
- Total Liability: $1,240 + $4,560 + $10,670 = $16,466.
Profile C: High-Earner ($280,000 Gross, Married Jointly)
- Taxable Income: Gross Income ($280,000) minus Standard Deduction ($32,200) = $247,800.
- First Bracket (10%): The first $24,800 is taxed at 10% = $2,480.
- Second Bracket (12%): The segment between $24,800 and $100,800 ($76,000) is taxed at 12% = $9,120.
- Third Bracket (22%): The segment between $100,800 and $211,400 ($110,600) is taxed at 22% = $24,332.
- Fourth Bracket (24%): The remaining segment ($247,800 - $211,400 = $36,400) is taxed at 24% = $8,736.
- Total Liability: $2,480 + $9,120 + $24,332 + $8,736 = $44,648.
Tax Reform Update: The One Big Beautiful Bill Act (OBBBA) of 2026
For tax years 2025 through 2028, the One Big Beautiful Bill Act (OBBBA) introduces four brand-new federal tax deductions that can significantly lower your taxable income if you qualify:
- No Tax on Tips: W-2 employees can claim an above-the-line deduction of up to $25,000 in qualified tips. The benefit phases out linearly for single filers with MAGI between $150,000 and $400,000 ($300,000 to $550,000 for married couples filing jointly).
- No Tax on Overtime: Eligible W-2 workers can claim an above-the-line deduction of up to $12,500 ($25,000 joint) in premium overtime pay. The phase-out range is $150,000 to $275,000 MAGI for single filers ($300,000 to $550,000 joint).
- Senior Deduction: An additional below-the-line deduction of $6,000 is available for W-2 workers and retirees age 65 and older ($12,000 if both spouses qualify), phasing out between $75,000 and $175,000 MAGI for single filers ($150,000 to $250,000 joint).
- Auto Loan Interest: Taxpayers can deduct up to $10,000 in annual interest paid on new passenger vehicle loans, provided the vehicle was assembled in the United States. This above-the-line deduction phases out between $100,000 and $150,000 MAGI for single filers ($200,000 to $250,000 joint).
If you have income from W-2 tips, overtime hours, qualify as a senior, or bought a US-made car, you should model these provisions to determine your tax savings. Use our flagship OBBBA Total Savings Calculator to see how much you could save this year.