What is Compound Interest and How Does It Build Wealth?
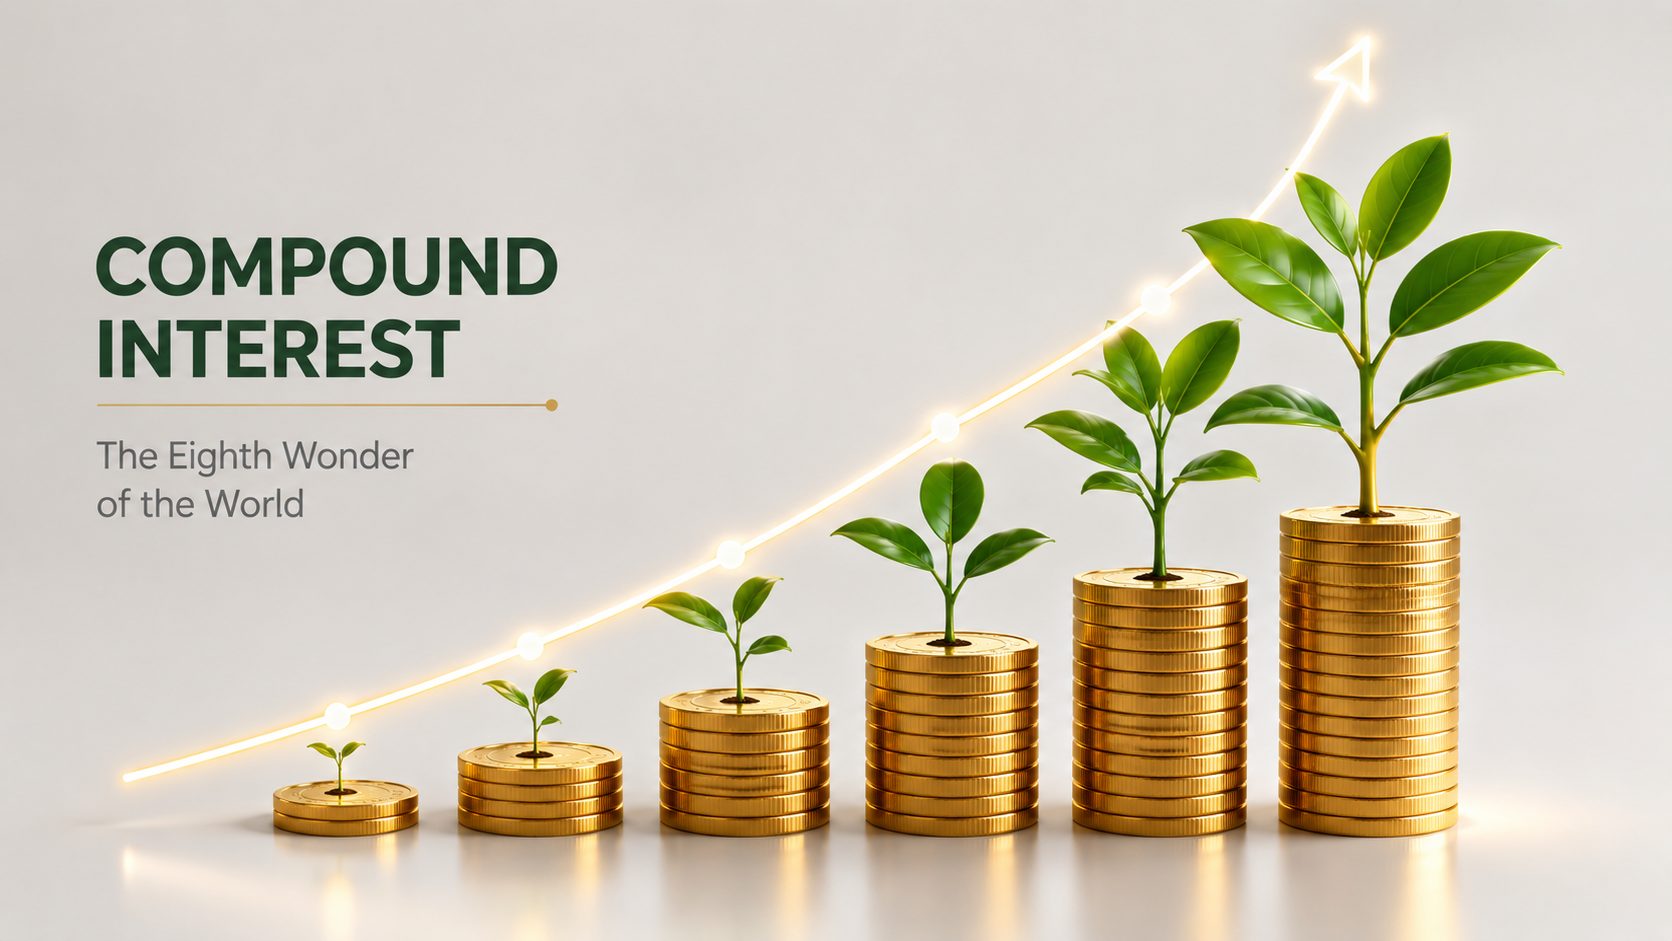
To use the power of compound interest, you must deposit principal into a compounding investment account, select a high-yielding product (such as low-fee stock index funds or high-yield savings accounts), and give the capital time to grow. Compound interest is calculated on both the initial principal and the accumulated interest from previous periods, creating a snowball effect of exponential growth. The earlier you start investing, the more time your interest has to compound, making time the most critical variable in personal wealth creation.
Quick Answer Summary
- Simple vs. Compound: Simple interest only pays interest on your original deposit, whereas compound interest adds earned interest back to your balance, meaning you earn interest on a larger amount in each subsequent period.
- The Growth Curve: Compounding growth is exponential, not linear. In the initial years, the growth is slow and feels negligible, but over 20 to 40 years, the curve bends upward dramatically.
- The Golden Rule: Start as early as possible. Time in the market is far more important than timing the market.
The Math of Compounding: Discrete vs. Simple Interest
To appreciate compounding, you must contrast it with simple interest:
- Simple Interest: Interest is calculated solely on your initial deposit. If you invest $10,000 at 5% simple interest, you earn $500 every year. After 30 years, your total balance is $25,000 ($10,000 principal + $15,000 interest).
- Compound Interest: Interest is calculated on your current balance. In Year 1, you earn $500. In Year 2, you earn 5% of $10,500 = $525. In Year 3, you earn 5% of $11,025 = $551.25. After 30 years, your balance compounds to $43,219! Compounding earned you an extra $18,219 with zero additional effort.
The Compound Interest Formula & Variables
Discrete compounding growth is calculated using the following formula:
A = P × (1 + r/n)^(n × t)
Where:
- A = the future value of the investment, including interest.
- P = the principal investment amount (initial deposit).
- r = the annual interest rate (as a decimal, e.g. 8% = 0.08).
- n = the number of times interest compounds per year (e.g. 12 for monthly, 1 for annually).
- t = the number of years the money is invested.
The Compounding Frequency Impact
The more frequently your interest compounds, the faster your wealth grows. Below is a comparison of how compounding frequency affects a $10,000 investment at an 8% annual return over 20 years:
| Compounding Frequency (n) | Future Value (A) | Net Interest Earned |
|---|---|---|
| Annually (n = 1) | $46,610 | $36,610 |
| Semi-Annually (n = 2) | $48,010 | $38,010 |
| Monthly (n = 12) | $49,268 | $39,268 |
| Daily (n = 365) | $49,522 | $39,522 |
$10,000 at 8% for 20 years: compounding frequency
While the difference between monthly and daily compounding is minor, the jump from annual to monthly compounding is significant, which is why most savings accounts and bonds compound monthly or daily.
Case Study: Sarah vs. Michael (The Cost of Delay)
Let's analyze two investors, Sarah and Michael, both earning an average annual return of 8% on their portfolios:
- Sarah starts investing $200/month at age 25. She stops contributing at age 35, having contributed a total of $24,000. She lets her portfolio compound untouched for another 30 years until she turns 65.
- Michael waits until age 35 to start. He contributes $200/month consistently for 30 years until he turns 65, contributing a total of $72,000.
The Final Balances at Age 65:
- Sarah's Portfolio: $302,000
- Michael's Portfolio: $300,000
Sarah (starts at 25) vs Michael (starts at 35)
Verdict: Even though Michael invested three times more cash than Sarah, Sarah ended up with a larger portfolio simply because she started 10 years earlier. Her money had an extra decade to compound. This highlights the cost of delay in investing.
The Rule of 72: A Quick Calculation Hack
To estimate how fast your money will double at a given interest rate, use the Rule of 72:
Years to Double = 72 ÷ Annual Interest Rate
For example:
- At a 6% interest rate, your money doubles in 12 years ().
- At an 8% interest rate, your money doubles in 9 years ().
- At a 12% return, your money doubles in 6 years ().
This mental math tool helps you quickly assess the long-term impact of different investment yields.
Actual Investment Products Compared
To benefit from compounding, you must choose the right investment product:
- High-Yield Savings Accounts (HYSAs): Offer 4% to 5% yields, guaranteed by the government (FDIC/DICGC). Capital is safe and liquid, making HYSAs ideal for emergency funds.
- Government Treasury Bonds: Yield 3.5% to 4.5% with fixed terms, providing low-risk income.
- Stock Index Funds (S&P 500 / MSCI World): Historically yield 8% to 10% per year over 20+ year horizons. While they carry short-term capital risk, they are the premier engine for long-term compound growth.
Tax Implications: Protecting Your Compound Growth
Taxes are a significant drag on compounding returns. If you pay taxes on capital gains or dividends every year, you have less money remaining to compound. To protect your growth:
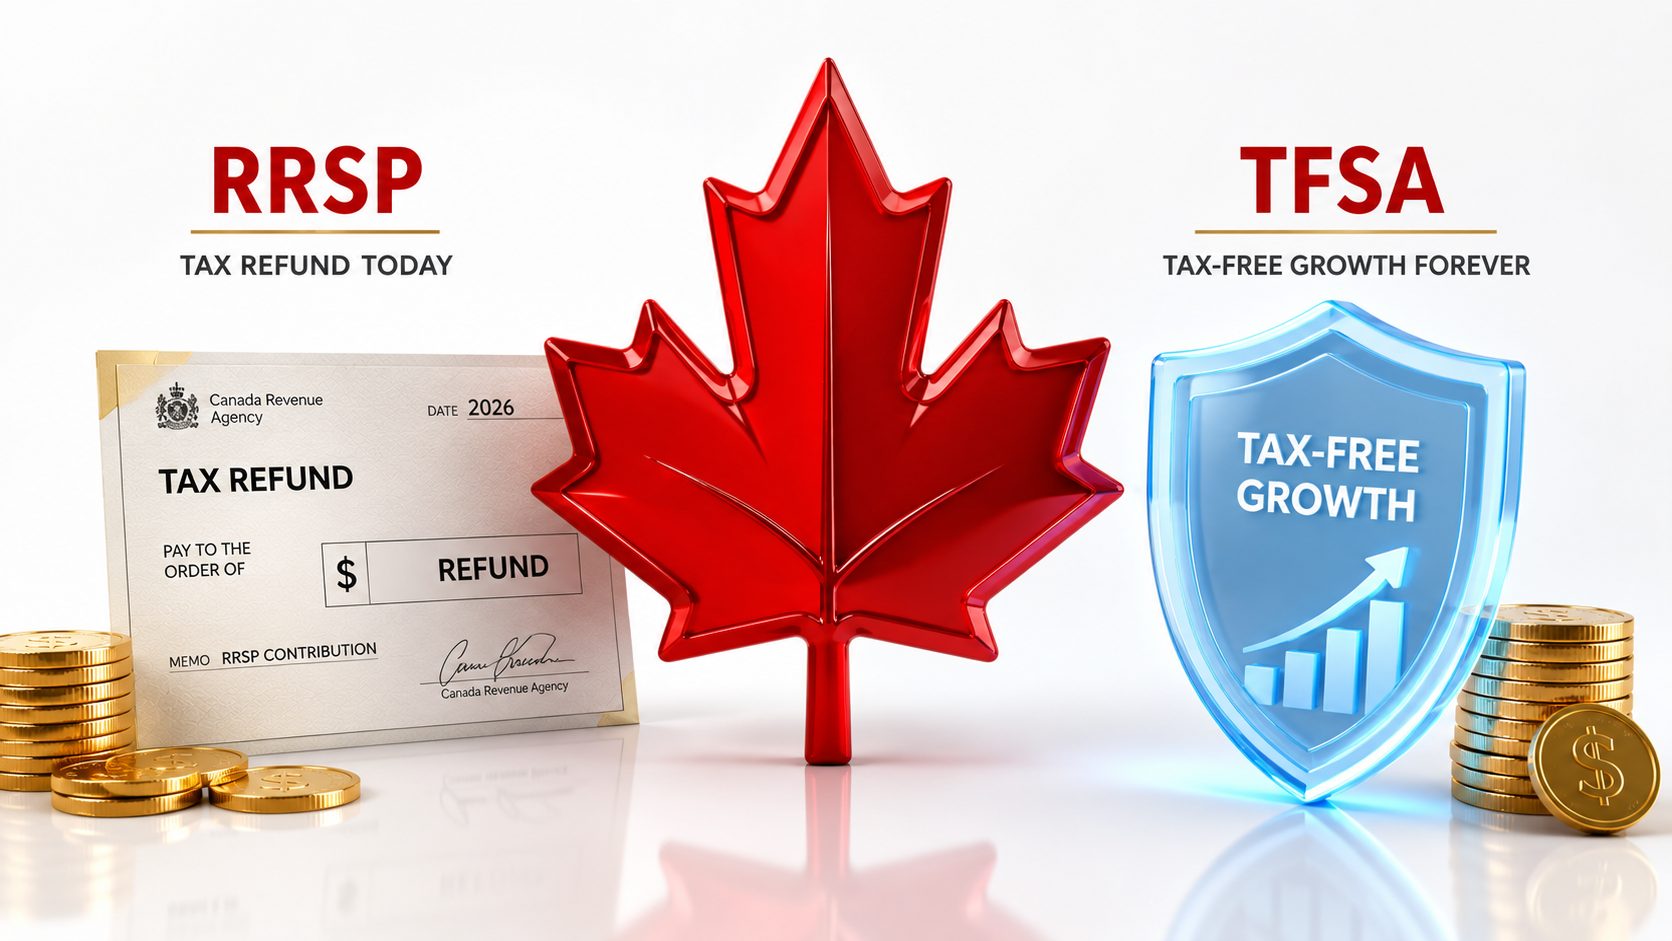
- Use tax-advantaged wrappers like a Roth IRA, Traditional IRA, or 401(k) in the US, or ISAs in the UK.
- These accounts allow your investments to compound tax-free or tax-deferred, saving you hundreds of thousands of dollars in lifetime taxes compared to taxable brokerage accounts.
Use the Compound Interest Calculator to input your monthly contributions and compounding frequency to project your future wealth.
Advanced Strategic Implementation & Optimization for Compound Interest
Harnessing compound interest requires understanding the mathematical variables of time, contribution frequency, and rate of return.
Compounding Optimization Checklist
- Start as Early as Possible: Time is the most critical factor; starting ten years earlier can double your final portfolio value.
- Reinvest All Dividends: Set your brokerage account to automatically reinvest dividends (DRIP) to buy more shares.
- Automate Monthly Contributions: Establish recurring deposits (SIPs) to benefit from dollar-cost averaging.
Step-by-Step Compounding Plan
- Determine Your Financial Goal: Target a specific net-worth milestone based on your retirement timeline.
- Select Low-Cost Equity Vehicles: Open a brokerage account and invest in broad-market index funds (e.g., S&P 500 or Nifty 50).
- Set Up Automatic Deposits: Establish monthly transfers on the day you receive your salary.
- Reinvest Growth Channels: Ensure all capital gains and dividends are kept inside the investment wrapper.
Common Pitfalls & Audit Warnings
- Interrupting Compounding: Selling assets during market drops halts the compounding cycle and locks in losses.
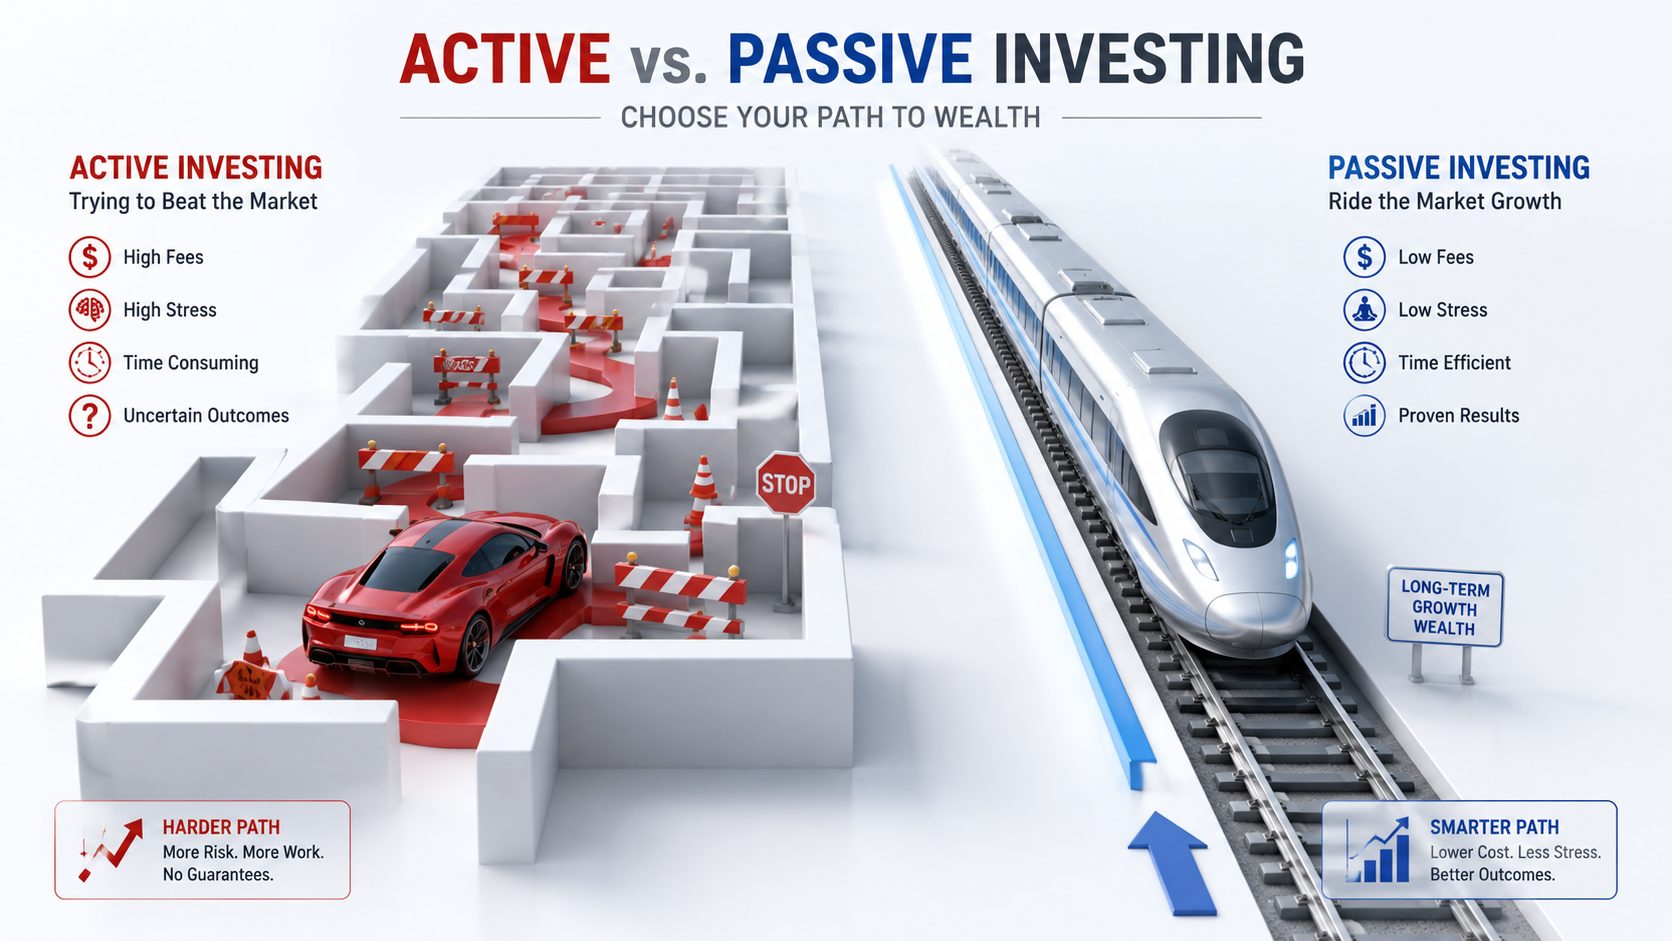
- Neglecting Fees: High expense ratios on active mutual funds erode compounding returns over long horizons.
- Underestimating Inflation: Failing to adjust your target savings goal for inflation can leave you with less purchasing power than projected.
Advanced Investment Compounding & Equity Scenario Modeling
We compare three compounding paths to demonstrate the exponential impact of time and contribution frequency on final portfolio size.
Compounding Growth Comparison Table
| Metric | Profile A: The Procrastinator | Profile B: Late Starter | Profile C: Early Compounder |
|---|---|---|---|
| Starting Age | Age 35 | Age 25 | Age 20 |
| Monthly Contribution | $500 | $500 | $500 |
| Duration | 25 Years | 35 Years | 40 Years |
| Annual Return Rate | 8.0% | 8.0% | 8.0% |
| Total Out-of-Pocket | $150,000 | $210,000 | $240,000 |
| Final Portfolio | $475,500 | $1,148,000 | $1,754,000 |
$500/month at 8%: what your start age decides
Step-by-Step Milestone Progression
Profile C: Early Compounder (Age 20 Start)
- Year 10 (Age 30): Out-of-pocket deposits of $60,000 compound to $91,400.
- Year 20 (Age 40): Balance grows to $289,500.
- Year 40 (Age 60): Portfolio hits $1,754,000 with only $240,000 total contributions.
4. Why Starting to Invest at Age 22 vs Age 32 Creates a $200k+ Wealth Gap
The most critical factor in compound growth is not the amount of money you invest, but the time you allow that money to compound. To see the dramatic cost of waiting, let's compare two investors, Alex and Beatrice, who both want to retire at age 65 and earn a consistent 8% annual return:
- Alex (Starts at Age 22): Invests $200 per month for just 10 years, then stops contributing entirely at age 32. He leaves the accumulated balance to compound untouched for the next 33 years.
- Total Personal Contribution: $24,000
- Beatrice (Starts at Age 32): Waits 10 years to start, then invests $200 per month every single month for the next 33 years until retirement.
- Total Personal Contribution: $79,200
The Retirement Results
- Alex's Ending Balance: $368,000
- Beatrice's Ending Balance: $352,000
Despite contributing $55,200 less of his own money, Alex retires with a larger nest egg than Beatrice simply because his money had an extra 10 years of compounding at the beginning of his adult life. This is the "cost of delay" in action.
5. The Fee Drag Problem: How a 1% Fund Fee Destroys 30% of Your Compound Growth
When investing in mutual funds or ETFs, the expense ratio (annual fee) might seem insignificant. However, fees compound against you in the exact same way that returns compound for you.
Let's assume you invest $10,000 as a lump sum and contribute $500 per month for 35 years, earning a 9% gross annual return:
- Scenario A (Low-Cost Index Fund): Expense ratio of 0.10% (Net return: 8.90%)
- Ending Balance: $1,385,000
- Total Fees Paid: $22,000
- Scenario B (Active Mutual Fund): Expense ratio of 1.10% (Net return: 7.90%)
- Ending Balance: $1,080,000
- Total Fees Paid: $327,000
By choosing a fund with a 1.10% fee instead of a 0.10% index fund, you lose $305,000 of your retirement wealth — representing over 22% of your potential nest egg eaten away by fee drag.
The fee drag: 0.10% vs 1.10% expense ratio over 35 years
6. Compound Interest vs. Inflation: What is Your Real Purchasing Power?
When projecting compound growth, it is easy to get excited about large future numbers. However, you must account for inflation, which reduces the purchasing power of your money over time.
- Nominal Return: The percentage growth of your account balance (e.g., a stock market return of 9%).
- Real Return: The return adjusted for inflation. If inflation is 2.5% and your nominal return is 9.0%, your real return is approximately 6.5%.
If you save $1,000,000 in a retirement account, in 30 years at 2.5% inflation, that $1,000,000 will only buy what $476,000 buys today. To model your future lifestyle accurately, always run your compounding projections using a real rate of return (e.g., 6% to 7% for stocks) rather than the nominal rate.